Make a Donation
Give to a qualified scholarship granting organization (SGO).
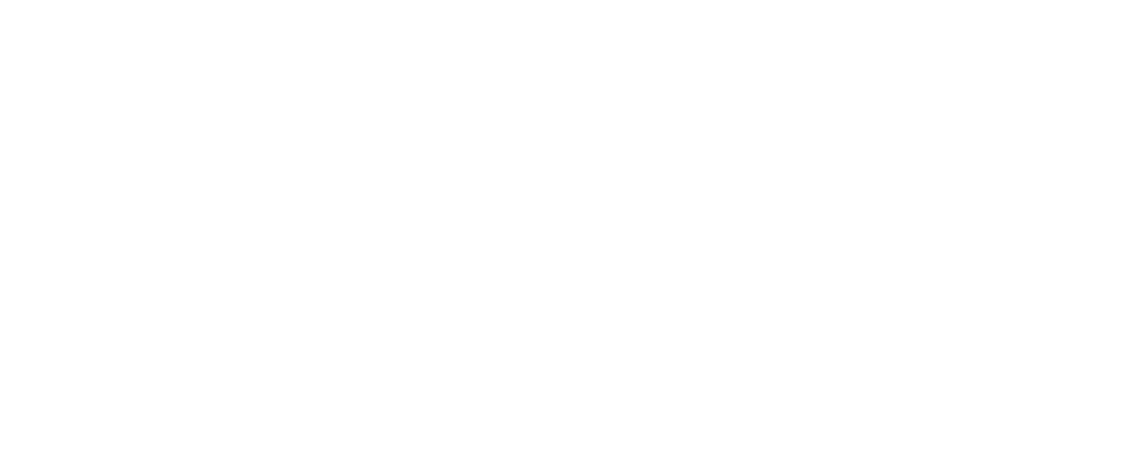
The Eligible K-12 Student Population Under the New Federal Education Freedom Tax Credit (EFTC)
The first state-by-state estimates of the number and share of children eligible to enroll in a K-12 school and receive a scholarship under Section 25F of the IRS Code.
No sign-up required · Instant download
Estimates project that nearly 52 million K-12 students are eligible for the Education Freedom Tax Credit (EFTC) scholarship beginning in 2027.
Eligibility is near-universal in every state. The eligible share ranges from 85.9% (DC) to 96.2% (Maine).
31 states have opted in or signaled intent to participate, home to 30.9 million eligible students (59.8% of the national total).
20.8 million eligible students are waiting in the 19 states and DC that have not yet decided.
For 20.5 million students, the EFTC could bring private school choice to their state for the first time. 18 states currently have no state-level ESA, voucher, or tax credit scholarship program.
Most families qualify. The income limit is 300% of area median income, which ranges from ~$234,000 to nearly $500,000 for a family of four, depending on location.
Students
51.7 Million
Of school aged students
91.7%
The number and share of K-12 students eligible for a scholarship under the Education Freedom Tax Credit.
| State | Eligible studentsStudents | Percent eligible% | Opted inIn |
|---|---|---|---|
| Alabama (AL) | 818,576 | 94.1% | ✓ |
| Alaska (AK) | 125,680 | 95.1% | ✓ |
| Arizona (AZ) | 1,124,713 | 89.2% | |
| Arkansas (AR) | 480,979 | 88.2% | ✓ |
| California (CA) | 5,909,150 | 92.4% | |
| Colorado (CO) | 895,202 | 93.6% | ✓ |
| Connecticut (CT) | 494,099 | 87.9% | |
| Delaware (DE) | 149,238 | 91.4% | |
| District of Columbia (DC) | 77,669 | 85.9% | |
| Florida (FL) | 3,181,773 | 91.9% | ✓ |
| Georgia (GA) | 1,756,946 | 88.6% | ✓ |
| Hawaii (HI) | 195,452 | 91.3% | |
| Idaho (ID) | 329,570 | 88.4% | ✓ |
| Illinois (IL) | 1,924,749 | 92.5% | |
| Indiana (IN) | 1,164,165 | 94.8% | ✓ |
| Iowa (IA) | 519,553 | 92.3% | ✓ |
| Kansas (KS) | 503,398 | 93.3% | ✓ |
| Kentucky (KY) | 733,009 | 93.5% | ✓ |
| Louisiana (LA) | 772,585 | 93.8% | ✓ |
| Maine (ME) | 185,394 | 96.2% | |
| Maryland (MD) | 954,072 | 90.9% | |
| Massachusetts (MA) | 940,609 | 90.4% | |
| Michigan (MI) | 1,516,183 | 93.4% | |
| Minnesota (MN) | 917,616 | 90.6% | |
| Mississippi (MS) | 481,487 | 93.9% | ✓ |
| Missouri (MO) | 938,113 | 88.5% | ✓ |
| Montana (MT) | 160,267 | 86.4% | ✓ |
| Nebraska (NE) | 356,531 | 95.8% | ✓ |
| Nevada (NV) | 481,210 | 89.2% | ✓ |
| New Hampshire (NH) | 173,902 | 90.2% | ✓ |
| New Jersey (NJ) | 1,430,040 | 92.1% | |
| New Mexico (NM) | 310,281 | 87.9% | |
| New York (NY) | 2,738,774 | 90.2% | ✓ |
| North Carolina (NC) | 1,697,487 | 92.7% | ✓ |
| North Dakota (ND) | 121,666 | 86.6% | ✓ |
| Ohio (OH) | 1,866,296 | 93.5% | ✓ |
| Oklahoma (OK) | 674,861 | 89.2% | ✓ |
| Oregon (OR) | 577,409 | 88.9% | |
| Pennsylvania (PA) | 1,802,463 | 89.0% | |
| Rhode Island (RI) | 139,734 | 91.2% | |
| South Carolina (SC) | 782,521 | 87.7% | ✓ |
| South Dakota (SD) | 153,979 | 90.3% | ✓ |
| Tennessee (TN) | 1,132,199 | 94.0% | ✓ |
| Texas (TX) | 5,485,719 | 92.8% | ✓ |
| Utah (UT) | 658,201 | 90.3% | ✓ |
| Vermont (VT) | 77,483 | 88.1% | |
| Virginia (VA) | 1,371,656 | 94.2% | ✓ |
| Washington (WA) | 1,190,408 | 93.1% | |
| West Virginia (WV) | 257,955 | 95.2% | ✓ |
| Wisconsin (WI) | 875,317 | 90.9% | |
| Wyoming (WY) | 90,214 | 89.4% | ✓ |
| United States | 51,696,553 | 91.7% | 31 |
Notes: Estimates give the number of children eligible to enroll in a K-12 school whose household income is under 300% of the median income for their area (as published by HUD), the eligibility limit for scholarships under the federal Education Freedom Tax Credit. Estimates reflect anticipated rules on homeschool eligibility, which will likely defer to state laws on the legal status of homeschool students in each state. Percentages are the share of each state's K-12-eligible children. A green check (✓) marks the 31 states that have opted in to the EFTC as of July 2026; the list will grow as more states decide. Source: American Federation for Children analysis of Census Population Estimates, American Community Survey, HUD Income Limits, and Household Pulse Survey data (2026). Opt-in status: federalscholarships.com. Learn more about our affiliated scholarship granting organization at afcscholarshipfund.org.
Give to a qualified scholarship granting organization (SGO).
The SGO turns donations into scholarships for students who need them.
Funds cover educational costs: tuition, tutoring, books, and more.
At filing, the donor claims a dollar-for-dollar federal credit of up to $1,700.
Patrick Graff is a Senior Fellow with the American Federation for Children. At AFC, he advises the Government Affairs team on school choice policy design and research.